|
|
| METHODS OF INFORMATION ACQUISITION FOR PLANNING
(MEASUREMENTS, WIND TUNNELS, NUMERICAL MODELLING) |  |
| | | |
 4.2.2.1 Visualization of flows and pollutant dispersion by smoke 4.2.2.1 Visualization of flows and pollutant dispersion by smoke |
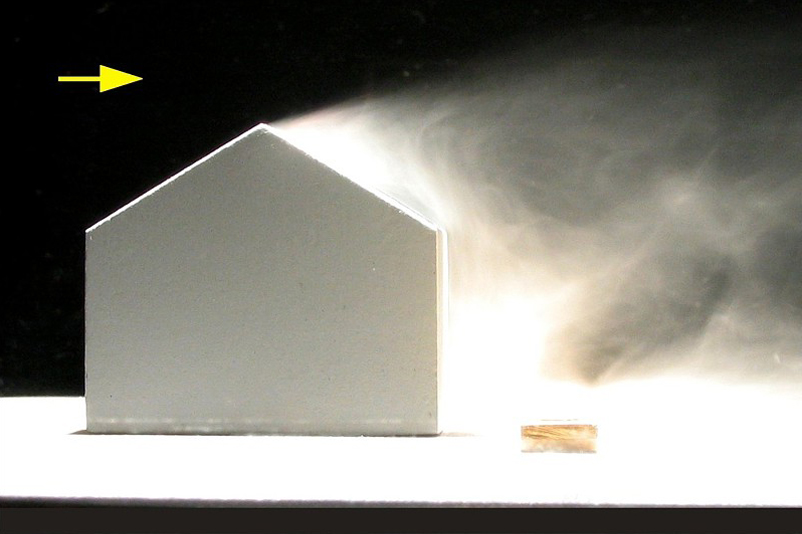
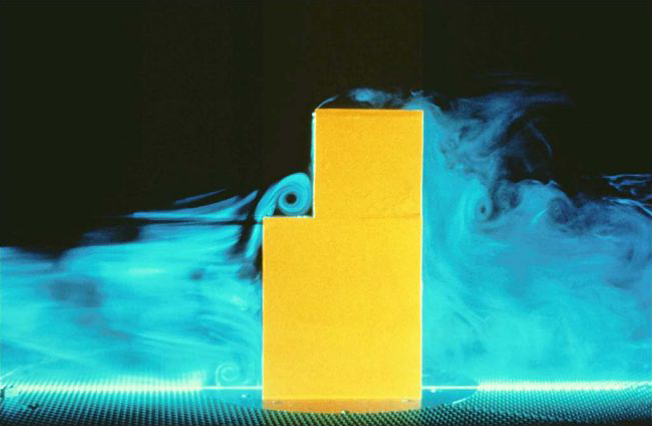
Smoke is blown into the boundary layer through special inlets to visualise the flow. Special changes in the flow, e.g. wake eddies, can so be distinguished (Figure. 4/10a and Figure 4/10b).
Smoke can also be blown through potential pollutant sources (like a chimney) in order to visualise the dispersion of the pollutants. The dispersion of the smoke within the area under investigation as well as its dilution are visualised and can be photographed or videotaped. Quantitative conclusions on the concentrations are not possible however. But the method can be very useful for a general illustration of this kind of problem.
|
|
| | | |
 |
| Fig. 4/10a: Follow-up zone of a building in a wind tunnel , with smoke visible , Source: Engineering Office Theurer | | |
 |
Fig. 4/10b: Vertical flow field of a building in a wind tunnel, with smoke visible, Source: University of Karlsruhe , Institute for Hydromechanics
Flow field as animation |
|
