|
|
| METHODS OF INFORMATION ACQUISITION FOR PLANNING
(MEASUREMENTS, WIND TUNNELS, NUMERICAL MODELLING) |  |
| | | |
 4.2.2 Operation and Investigation Methods 4.2.2 Operation and Investigation Methods |
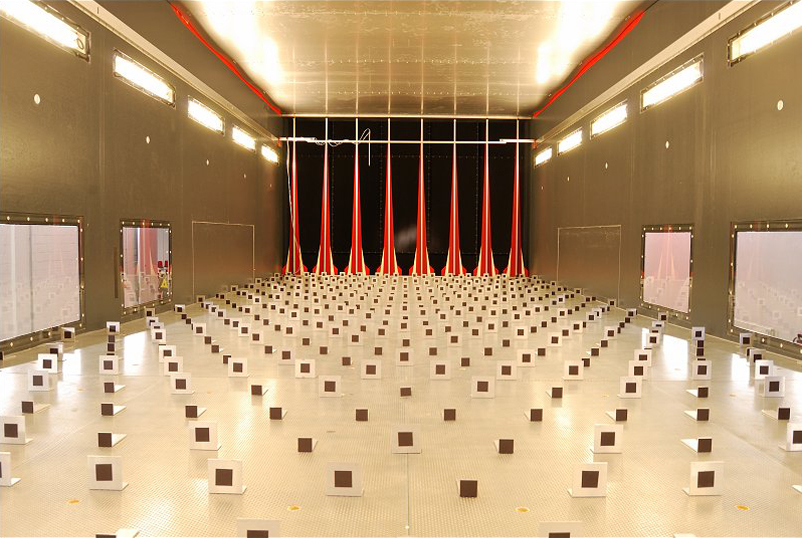
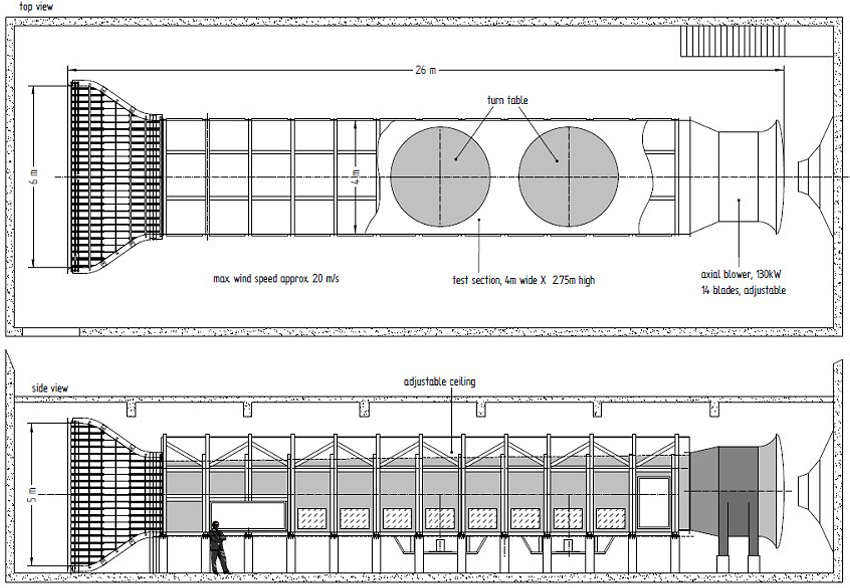
For urban climate studies in wind tunnels it is necessary to produce a wind profile corresponding to the natural conditions. In the wind tunnel this is produced when the air current, at first homogenous and low in turbulence when entering through the intake, is passed by so-called eddy generators and rough surface areas (see Fig. 4/7 and Fig. 4/7a). The eddy generators block the lower cross-section of flow more than the upper and thereby form the profile of a typical boundary layer before the shearing turbulence produced by the roughness of the ground can intrude into the airflow (Fig. 4/8). This is why boundary layer wind tunnels must have a minimum length proportional to the usable test track.
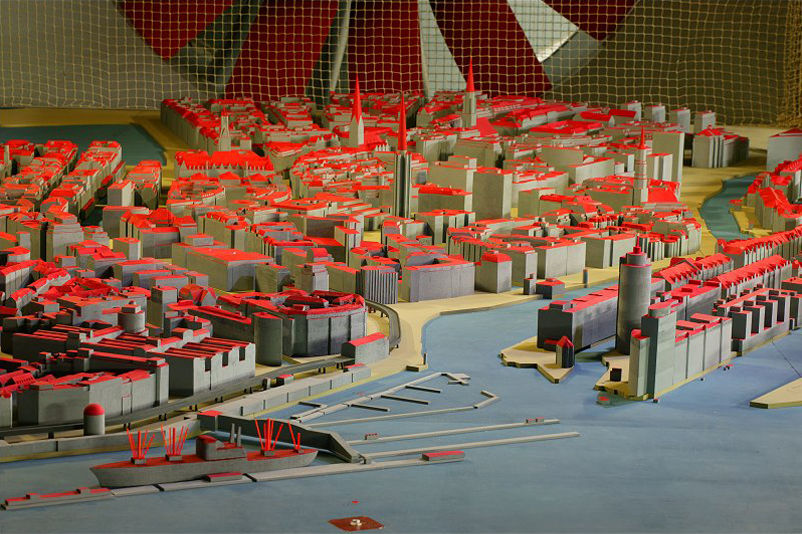
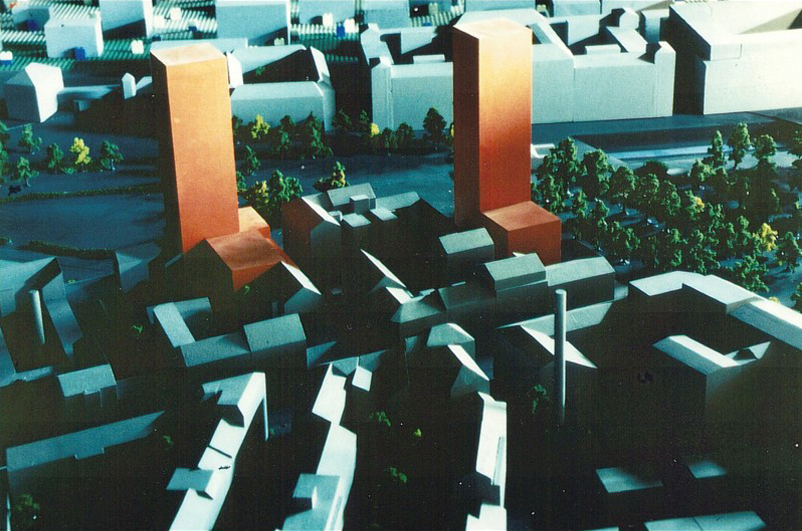
Since the theory of wind tunnel modeling cannot be dealt with in greater detail in the context of this booklet, the professional literature should be referred to (e.g. PLATE, 1982; SCHATZMANN et al., 1986). In studies of airflow mechanics it is important that the corresponding model guidelines (i.e. similarity criteria) are fulfilled so that the transferability of the results to the natural conditions can be established. This is the case when the distances in the model have a constant ratio to the distances in nature, and the flowing boundary layer and properties of the obstacles are "similar" to the natural conditions. The actual size of the model depends on the individual wind tunnel and the subject. A frequent size is a diameter of 2 metres and more. Figure 4/9a shows the model of an urban area in a wind tunnel; Figure 4/9b the wind tunnel model of two projected tower blocks within an existing development.
The advantage of wind tunnel studies over on-site measurements is the possibility to rapidly record and measure both the current state and drafts (including alternatives). The creation of an adequate physical model, however, can take some time. Another advantage of wind tunnel studies over model calculations is the high spatial and especially temporal resolution. The outlines of buildings cause no problems and even round shapes (like cupolas) can be faithfully reproduced. It is also possible to record transient flow and dispersion processes, like fluctuations of the wind direction, wind speed and concentrations, by generating time series (THEURER, 2012).
Different measuring methods are used depending on the question or on the desired accuracy of the results; what is often required is purely qualitative information. Generally, the following examination methods are used.
|
|
| | | |
 |
| Fig. 4/7: Turbulence generators and rough surface areas in the boundary layer wind tunnel Wotan, Source: University of Hamburg , Institute for meteorology | | |
 |
| Fig. 4/7a: Idealized urban roughness in the boundary layer wind tunnel Wotan, Source: University of Hamburg , Institute for meteorology | | |
 |
Fig. 4/8: Structure of a boundary layer wind tunnel, from above and from the side
Source: University of Hamburg , Institute for Meteorology | | |
 |
| Fig. 4/9a: Model in the wind tunnel, Source: University of Hamburg , Institute for Meteorology | | |
 |
| Fig. 4/9b: Wind tunnel model of two planned high-rise buildings in an urban development , Source: Engineering Office Theurer |
|
