|
|
| CHARACTERISTICS AND FORMS OF THE URBAN CLIMATE |  |
| | | |
 2.10 Effect of Pollutant 2.10 Effect of Pollutant |
The effect of air pollution both on vegetation – especially our forests – and on humans and their health still stands in the middle of political discussions about the environment. Especially breathing illnesses such as asthma, bronchitis, and even lung cancer, airborne pollutants are included under the assumed causes. In addition to the effects of short-term health problems, long-term health problems must also be taken into consideration. (LANDESAMT NRW, 2012; UBA, 2012).
The most frequent illnesses caused by air pollution are the following:- Irritations of the eyes and air passages from sulfur dioxide and nitrogen oxides,
- inflammations of the lungs, caused by sulfur dioxide in connection with airborne particles,
- cell damage from metals and soot,
- disruption of the oxygen exchange of the blood from carbon monoxide,
- Tumors resulting from effects of some hydrocarbons,
- psychosomatic diseases appearing in the form of general weaknesses in function and concentration.
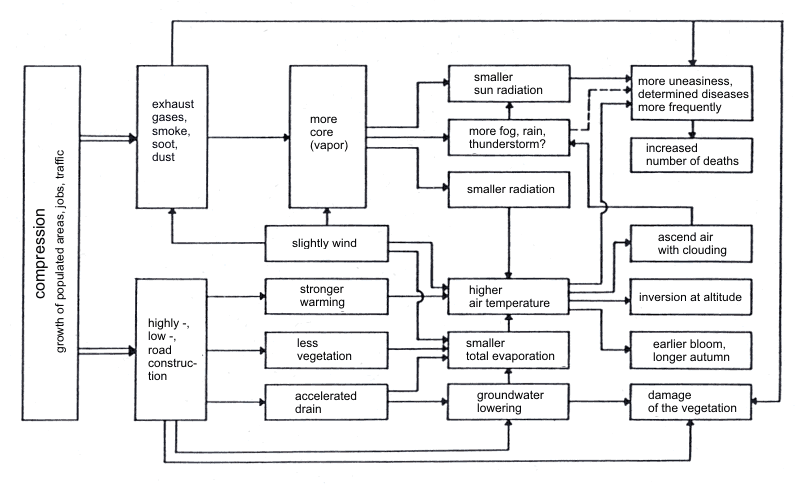
The following schematic representation (Fig. 2/24 shows the most significant relationships and influences as cause-and-effect structures (HAGEL, 1974).
|
|
| | | |
 |
Fig. 2/24: Schematic representation
of the significant relationships and influences of pollutant effects as an effect structure; HAGEL, 197 |
|
