|
|
| ENERGY-CONSCIOUS PLANNING AND ZONING |  |
| | | |
 3.4.1 Wind Statistics 3.4.1 Wind Statistics |
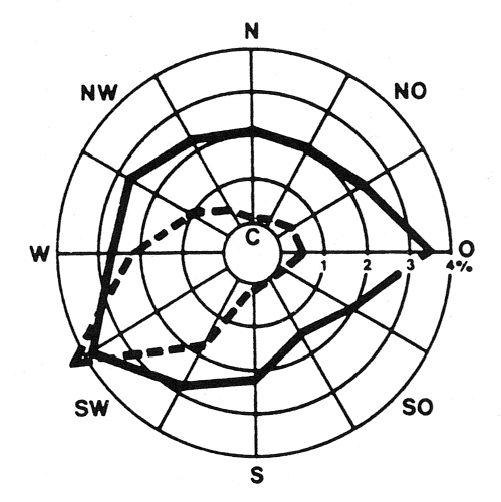
Wind has the rather unique property that it shows no practical constancy in the quantities that characterize it; on the contrary, it continuously and swiftly changes velocity and direction. Wind statistics are drawn from the evaluation of observations and measurements usually spanning many years. The wind rose gives the percentage frequency of the occurrence of individual wind directions (from which the wind emanates) according to the points of the compass. The frequency of the occurrence of zero winds (i.e. "calms") is usually recorded in a free field in the middle of the diagram. For calculations of energy usage, an evaluation of the annual distribution of wind direction according to the season is recommended, such as that for summer and winter shown in Figure 3/26.
Wind velocity is the other primary component of information about average wind conditions. The wind frequency/strength rose (short form: wind strength rose) depicts the frequency of occurrences of defined wind velocity ranges for each wind direction. In the case of Figure 3/27 an illustration form is chosen that juxtaposes the directional wind frequencies of two frequency ranges, namely very weak and very strong wind. The figure shows that the direction of the most frequent winds (the main wind direction) is identical to the direction of the strongest winds on average at the measurement location. At the same time, the East wind direction shows itself to be the typical direction of weak winds, whose frequency is only slightly less in this lower strength range of the main wind direction.
Table 3/2 gives an overview of the average wind velocities according to month and wind direction as well as for the yearly average (2.5 m/s at the city of Mannheim). The southwest wind is the strongest on average (3.6 m/s), while southeast winds only amount to an average 1.7 m/s. Over the course of the year in Mannheim, the months of January (3.2 m/s), March (3.0 m/s) and December (2.8 m/s) are the months of strongest winds. In Germany at large, the highest wind velocities are measured in November and the lowest are measured in August and September (compare with DIN 4710, Meteorological Data for Calculation of Energy Usage).
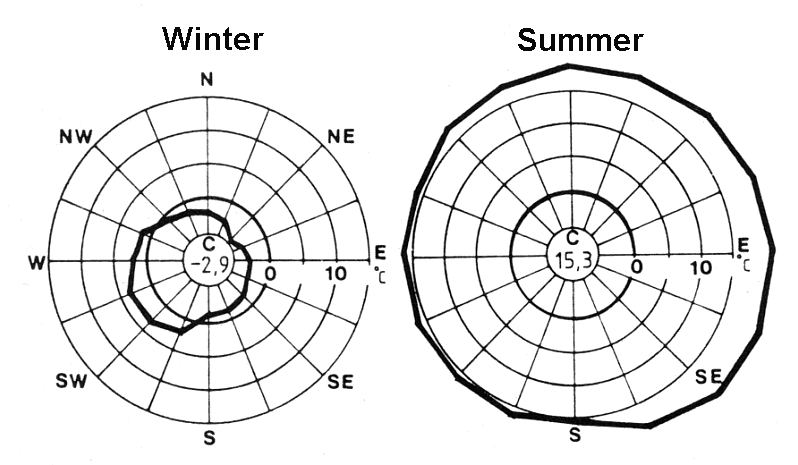
A wind temperature rose shows the combination of temporal sequences of wind and air temperature. This answers the question: Which temperatures arise when the wind comes from a specific direction at a measurement location? Since east winds in summer are associated with higher air temperatures while east winds in winter mean cold air, uniting the data into an annual statistic does not make sense. Only the seasonal differentiation shown in Figure 3/28 provides useful information in this regard.
| N | NO | O | SO | S | SW | W | NW | Mittel | January |
1,9 | 2,0 | 1,9 | 1,8 | 3,3 | 4,3 | 4,2 | 3,0 | 3,1 | February | 1,9 | 2,4 | 2,6 | 2,0 | 2,8 | 3,7 | 3,2 | 2,3 | 2,5 | March | 2,1 | 2,3 | 2,5 | 1,8 | 3,1 | 4,3 | 3,7 | 2,9 | 3,0 | April | 2,4 | 3,0 | 2,8 | 1,8 | 2,7 | 3,5 | 3,5 | 2,9 | 2,8 | May | 2,0 | 2,4 | 2,8 | 1,8 | 2,4 | 3,0 | 3,1 | 2,5 | 2,4 | June | 2,0 | 2,2 | 2,0 | 1,5 | 2,2 | 3,1 | 3,3 | 2,6 | 2,3 | July | 2,0 | 2,0 | 1,8 | 1,7 | 2,2 | 2,9 | 3,2 | 2,4 | 2,2 | August | 1,8 | 2,0 | 1,8 | 1,8 | 2,2 | 2,8 | 2,7 | 2,2 | 2,1 | Sept. | 1,6 | 1,9 | 1,5 | 1,4 | 2,6 | 3,1 | 3,2 | 2,0 | 2,1 | Oct. | 1,5 | 1,5 | 1,8 | 1,5 | 2,7 | 3,2 | 3,0 | 1,7 | 2,1 | Nov. | 1,6 | 2,2 | 2,1 | 1,2 | 3,0 | 3,9 | 3,7 | 2,1 | 2,7 | Dec. | 1,6 | 1,6 | 1,4 | 1,5 | 3,2 | 4,1 | 3,9 | 2,5 | 2,8 | Year | 1,9 | 2,2 | 2,2 | 1,7 | 2,8 | 3,6 | 3,4 | 2,5 | 2,5 |
Table 3/2: Average wind velocity in m/s; Mannheim 1976 -1986, Sorce: DIN 4710
|
|
| | | |
 |
Fig. 3/26: Wind roses for the summer half-year (solid line) where calms = 14% and the winter half-year (dashed line) where calms = 15.6%, Stuttgart airport,
Source: German Weather Service (DWD)
| | |
 |
| Fig. 3/27: Directional frequency of weak winds (0.5 to 1.5 m/s – solid line) and strong winds (5.5 m/s and up – dashed line) Source: German Weather Service (DWD) | | |
 |
| Fig. 3/28: Seasonal temperature wind roses (Stuttgart-Vaihingen, 1981-1985); under "C" (calms) the average measured air temperatures under zero winds are given. |
|
