|
|
| CLIMATIC AND AIR HYGIENE MAPS AS AIDS FOR PLANNING AND ZONING (EXAMPLE: CLIMATE ATLAS FEDERATION REGION STUTTGART) |  |
| | | |
 5.5 Air-Hygienic Maps 5.5 Air-Hygienic Maps |
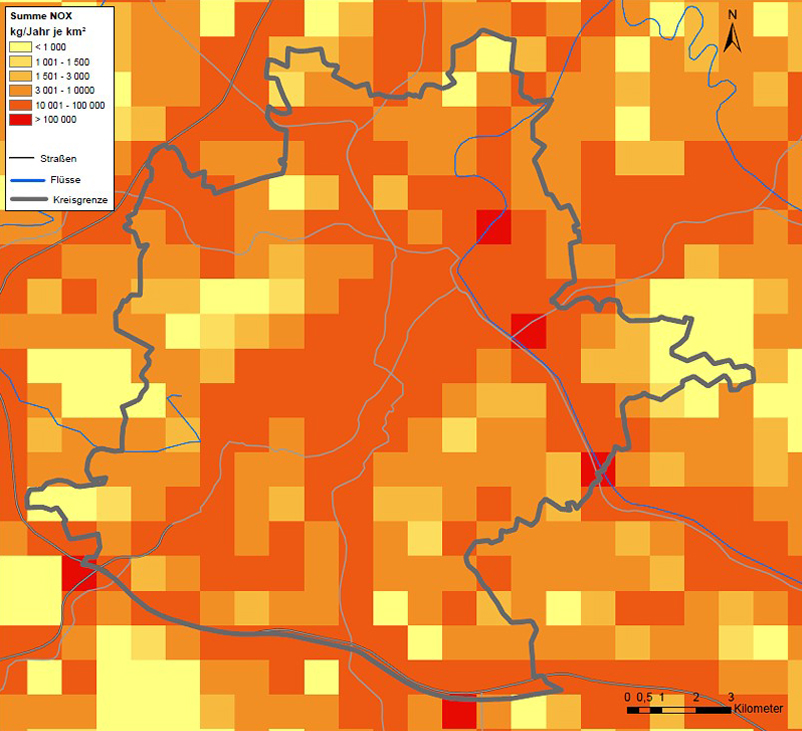
Data for air pollution in and around the Stuttgart study area are present in the emissions registers. produced by the State of Baden-Württemberg (see Figure 5/7a).
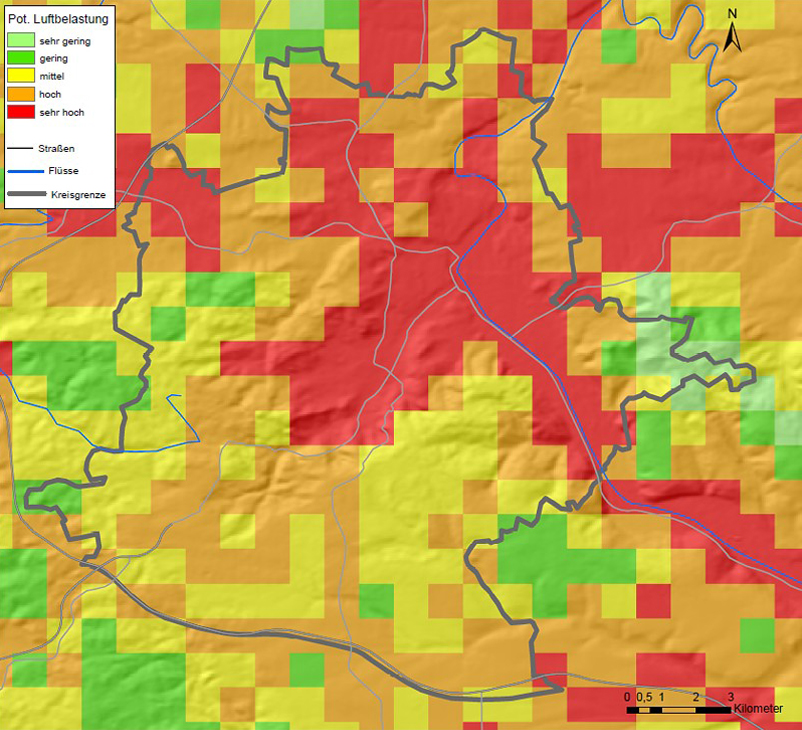
The Atlas also includes maps derived with high air pollution potential , calculated from the emissions and ventilation situation (see Figure 5/7).
|
|
| | | |
 |
| Fig. 5/7: Potential air pollution in the city of Stuttgart, Source: Climate Atlas Region Stuttgart 2008 | | |
 |
Fig. 5/7a: NOx annual emissions (sum of all source groups) in the city of Stuttgart, Source: Climate Atlas Region Stuttgart 2008
|
|
