|
|
| CLIMATIC AND AIR HYGIENE MAPS AS AIDS FOR PLANNING AND ZONING (EXAMPLE: CLIMATE ATLAS FEDERATION REGION STUTTGART) |  |
| | | |
 5.4 Cold Air Generation and Outflow, Wind Field Calculations 5.4 Cold Air Generation and Outflow, Wind Field Calculations |
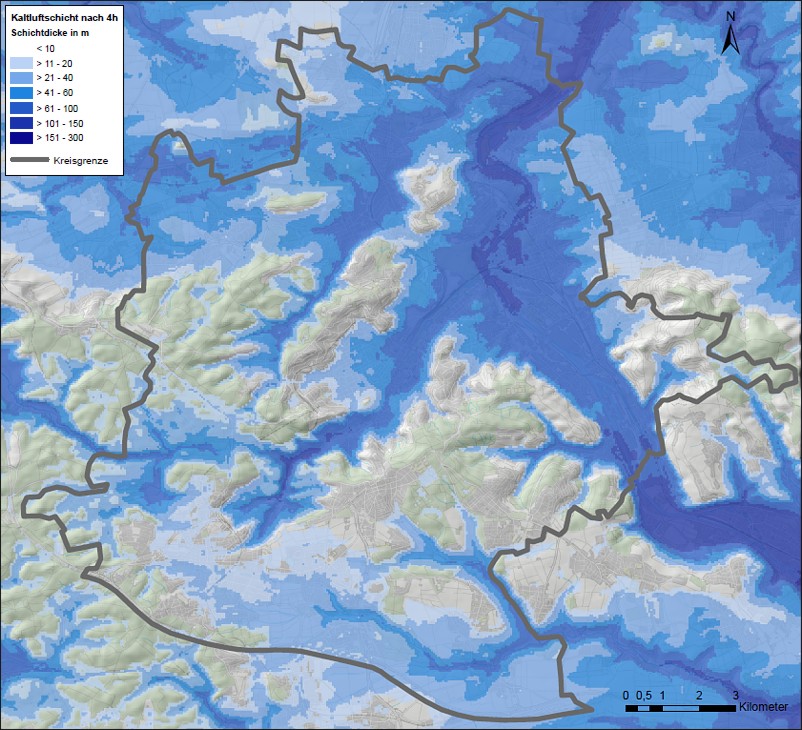
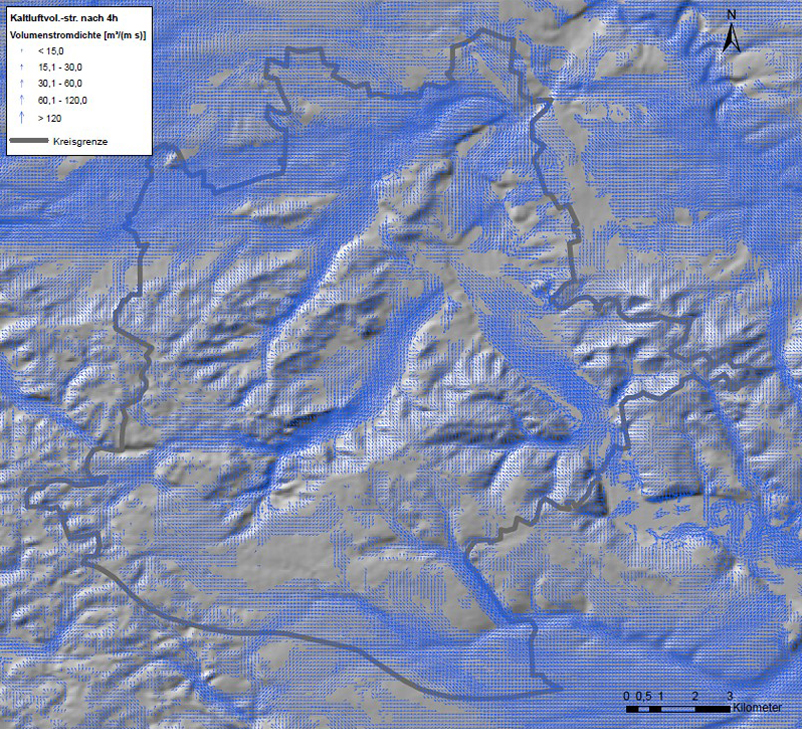
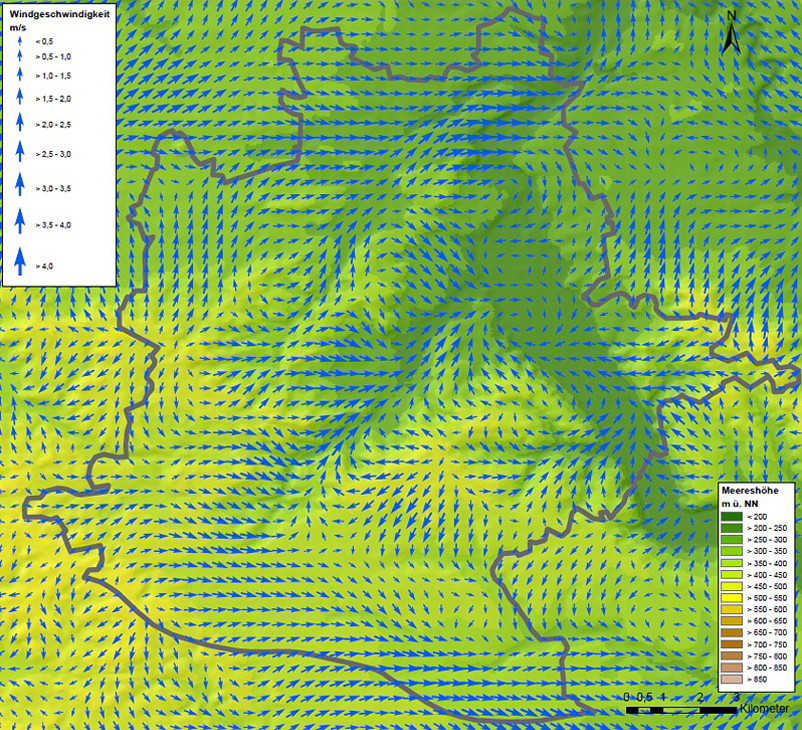
The digital climate atlas of the region of Stuttgart was not only spatially extended but took up new technical and content-related aspects. Region-wide calculations of the thickness (Figure 5/6) and drainage of cold air (Figure 5/6a) were carried out on the basis of the digital surface model and infrared thermography. As areas producing cold air and cold air catchment areas during inversion weather conditions bring about fresh air supply during the night, they have a substantial function for the aeration of settlement areas. The digital climate atlas also provides detailed information on the wind conditions. Synthetic wind field calculations (Figure 5/6b) also allow for an evaluation of small-scale wind conditions in the region. As the wind (characterised by wind speed and wind direction) determines the dispersion of air pollutants, it plays a major role for air quality. The knowledge of the aeration situation within settled areas gained from the factors wind and cold air is an important assessment foundation for spatial planning on both the regional and the municipal level.
|
|
| | | |
 |
| Fig. 5/6: Cold air thickness after 4 hours in the city of Stuttgart, Source: Climate Atlas Region Stuttgart 2008 | | |
 |
| Fig. 5/6a: Cold air flow after 4 hours in the city of Stuttgart, Source: Climate Atlas Region Stuttgart 2008 | | |
 |
| Fig. 5/6b: Wind field at 00:00 clock in the city of Stuttgart, Source: Climate Atlas Region Stuttgart 2008 |
|
